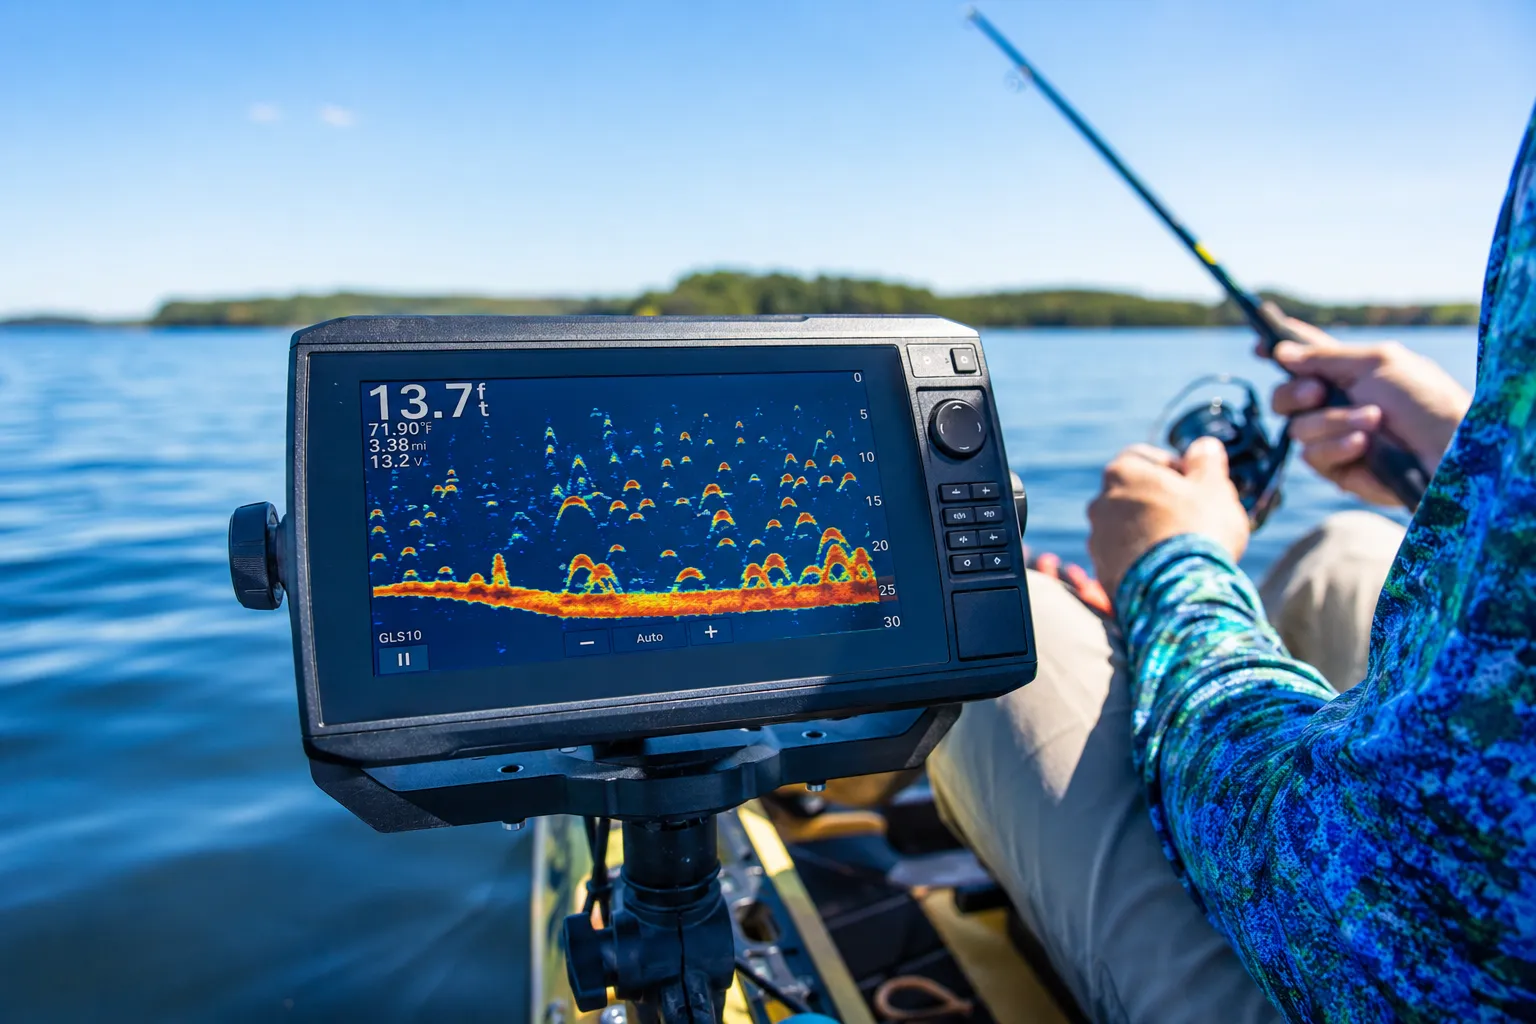
Quick Answer: Reading a fish finder screen involves interpreting colors (which indicate bottom hardness and object density), recognizing fish arches (curved marks that appear as fish pass through the sonar cone), distinguishing between fish and structure (fish create arches while structure shows as vertical or horizontal lines), and understanding depth scales and sensitivity settings to filter out clutter while maintaining useful detail.
Key Takeaways
- Colors indicate density and hardness: warm colors (red, orange) show hard objects or strong returns, while cool colors (blue, green) indicate softer materials or weaker signals
- Fish arches are curved marks that form as fish move through the sonar cone, though stationary fish may appear as horizontal lines or blobs
- Structure appears as vertical lines (standing timber, bridge pilings) or solid horizontal bands (bottom contour), distinctly different from fish arches
- Sensitivity settings control clutter: higher sensitivity shows more detail but also more noise, especially in shallow water or around vegetation
- Down imaging shows directly below your kayak in a narrow cone, while side imaging scans horizontally to reveal structure up to 200 feet on either side
- Thermoclines appear as horizontal bands where water temperature changes create a visible layer on the screen
- Bottom hardness is revealed by return thickness: a thin line indicates soft mud, while a thick bright band shows hard rock or gravel
- Baitfish schools look like clouds of small marks, while game fish appear as larger individual arches or marks
- CHIRP sonar provides better target separation but isn’t essential for reading fish accurately on most recreational units
What Do the Different Colors Mean on a Fish Finder Screen
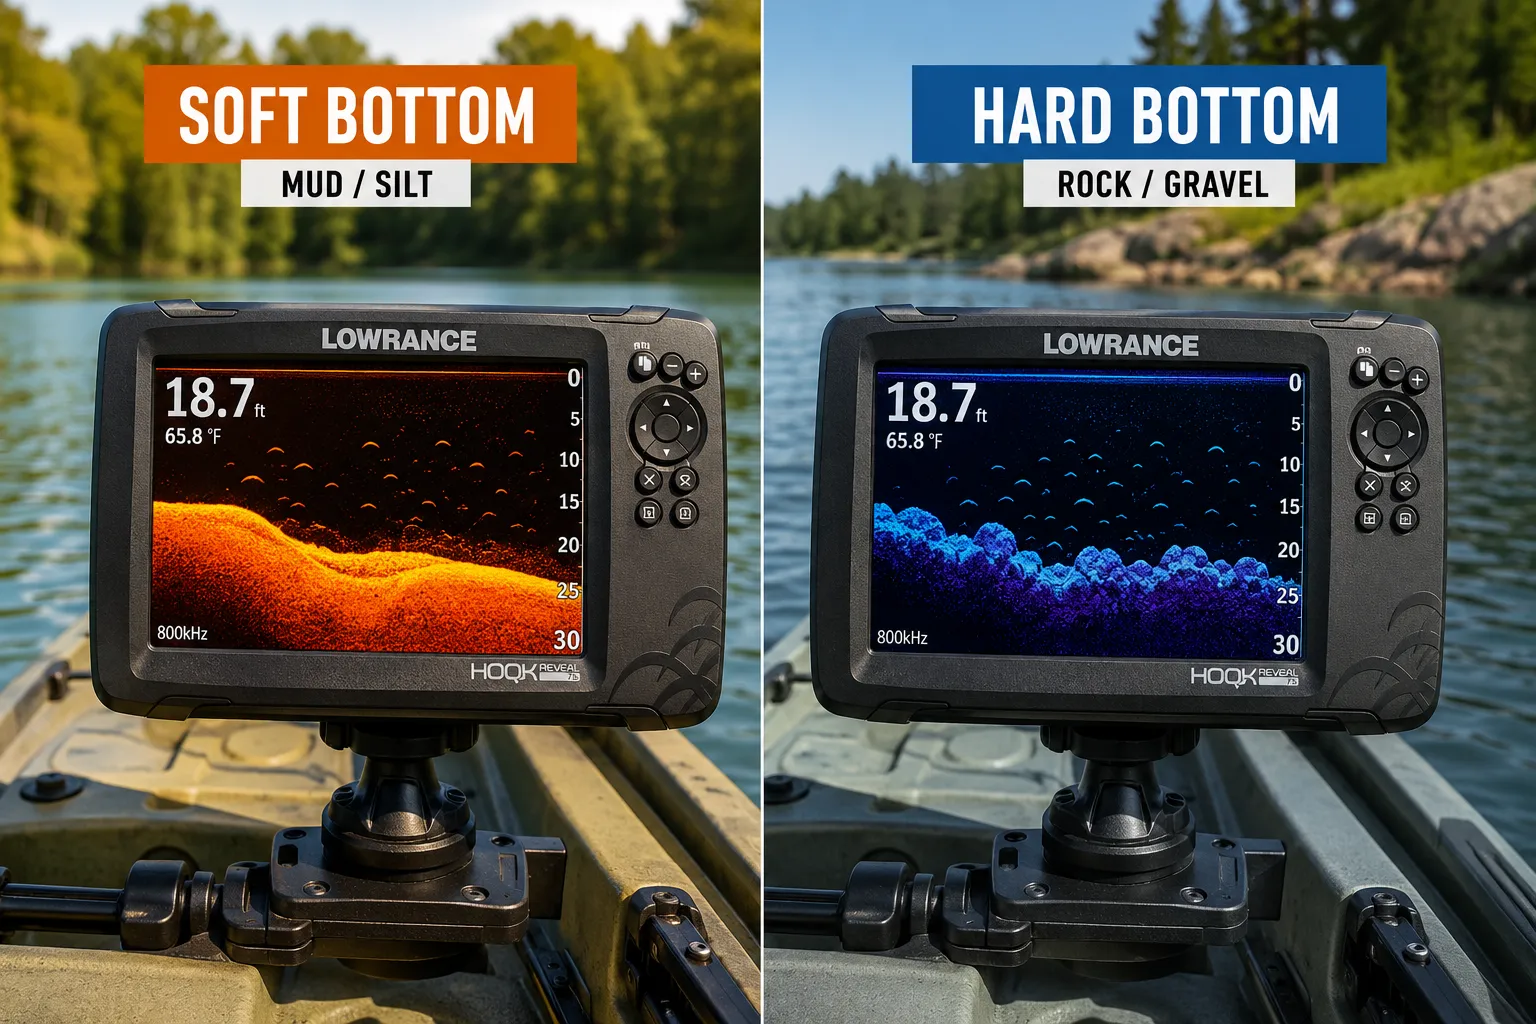
Colors on a fish finder screen represent signal strength and object density, not actual underwater colors. Warm colors like red, orange, and yellow indicate strong sonar returns from hard or dense objects, while cool colors like blue, green, and purple show weaker returns from soft materials or smaller targets.
The color palette helps you quickly assess what you’re seeing:
- Red and orange: Hard bottom (rock, gravel, shell beds), large fish, or dense structure like concrete pilings
- Yellow: Medium-density objects, smaller fish, or moderately hard bottom
- Green and blue: Soft bottom (mud, silt), vegetation, or weak returns from small baitfish
- Purple or black: Very weak returns or empty water with no targets
Most fish finders let you choose between different color palettes. The “classic” palette uses warm-to-cool gradients, while “whiteline” modes emphasize the bottom with a distinct white band. Pick the palette that’s easiest for your eyes to read in your typical lighting conditions, bright sunlight often requires high-contrast settings, while overcast days allow more subtle color gradients.
Common mistake: Assuming red always means fish. Red indicates signal strength, so a hard rocky bottom will show red even without any fish present. Look for the characteristic arch shape to confirm fish rather than relying on color alone.
How to Tell the Difference Between Fish and Structure on Sonar
Fish create curved arch-shaped marks on the screen as they pass through the sonar cone, while structure appears as straight vertical lines (standing timber, pilings) or solid horizontal bands (bottom contour, ledges). The key difference is movement and shape: fish arches curve because the fish enters and exits the sonar beam, while stationary structure maintains consistent vertical or horizontal geometry.
Here’s how to distinguish them:
Fish characteristics:
- Curved or arched marks (when the kayak or fish is moving)
- Suspended above the bottom with clear separation
- May appear as horizontal dashes if stationary
- Often found in groups at similar depths
- Thickness indicates fish size
Structure characteristics:
- Vertical lines that extend from bottom upward (trees, pilings, vegetation)
- Horizontal bands or shelves (ledges, drop-offs, layered bottom)
- Solid, consistent returns without gaps
- Remains in the same position if you circle back
- Often shows texture or branching (brush piles, stumps)
When fish hold tight to structure, they can be harder to separate. Look for small arches or marks that appear slightly offset from the main vertical structure line. Lowering your sensitivity slightly can help reduce clutter and make fish stand out, though you risk losing detail on smaller targets.
Decision rule: If you’re unsure whether a mark is fish or structure, circle back over the same spot. Structure will appear in the exact same location, while fish marks will either move or disappear entirely.
What Is the Fish Arch Symbol on My Fish Finder
The fish arch is a curved mark that appears on your screen when a fish passes through the sonar cone. The arch forms because the fish is closest to the transducer at the peak of the curve, creating the strongest return, then moves away as it exits the cone, creating the characteristic rainbow or arch shape.
The arch only appears when there’s relative motion between your kayak and the fish. If you’re drifting or paddling and a fish stays stationary, you’ll see a perfect arch. If both you and the fish are stationary, the mark appears as a horizontal line or thick dash. If the fish swims at the same speed and direction as your kayak, it may show as a continuous horizontal mark rather than an arch.
Arch characteristics that reveal information:
- Width: Indicates how long the fish stayed in the sonar cone (wider = slower-moving or larger cone coverage)
- Thickness: Shows fish size (thicker marks = larger fish, though this varies with depth)
- Color intensity: Reveals signal strength (brighter/warmer colors = stronger return, often from larger or denser fish)
- Depth position: Shows exactly where the fish is in the water column
Many modern fish finders have “Fish ID” modes that replace arches with fish icons. While this seems helpful for beginners, it’s less accurate than learning to read raw sonar. Fish ID algorithms often misidentify structure or clutter as fish, and they don’t show the detail that helps you judge fish size or behavior. Most experienced anglers turn Fish ID off and read the actual sonar returns.
Edge case: In very shallow water (under 5 feet), fish may not create full arches because they pass through the narrow sonar cone too quickly. Instead, look for thick horizontal marks or partial curves.
Best Sensitivity Settings for Reading Fish Finder in Shallow Water
For shallow water (under 10 feet), start with sensitivity set between 60-75% to reduce bottom clutter and vegetation noise while still showing fish clearly. Shallow water concentrates sonar returns in a small area, so too much sensitivity creates a cluttered screen filled with noise from every piece of grass, shell, or bottom irregularity.
Step-by-step sensitivity adjustment for shallow water:
- Start at 50% sensitivity and observe the screen for 30 seconds while moving
- Increase by 10% if you’re not seeing fish arches or if the bottom appears too thin
- Decrease by 10% if the screen shows excessive clutter, noise, or if the bottom band is overly thick
- Fine-tune in 5% increments until you see a clean bottom line with clear separation for any fish present
- Save the setting as a preset if your unit allows it, labeled for shallow water conditions
In water less than 5 feet deep, you may need to drop sensitivity as low as 40-50% to get a readable screen. The trade-off is that you might miss very small baitfish or subtle structure, but you’ll clearly see game fish and major bottom features.
Water clarity also affects optimal sensitivity: murky or muddy water scatters the sonar signal, requiring lower sensitivity to reduce noise. Clear water allows higher sensitivity settings without excessive clutter.
Common mistake: Leaving sensitivity on “auto” in shallow water. Auto modes often crank sensitivity too high in shallow conditions, filling your screen with noise. Manual control gives you a cleaner, more readable display.

Clear Vu scanning Sonar shows you more of what is in the water around your boat; This high frequency sonar gives near photographic images with detailed representations of objects, structure and fish

It is a portable and castable fish finder that comes with a wireless sonar probe/sensor. The maximum distance between the sensor and the handheld unit is 262FT/80M. No need to drill hole in your boat hull to install the sensor any more. Two small holes on the sensor allow you to tether it with your fishing line and cast it onto water as far as you want.
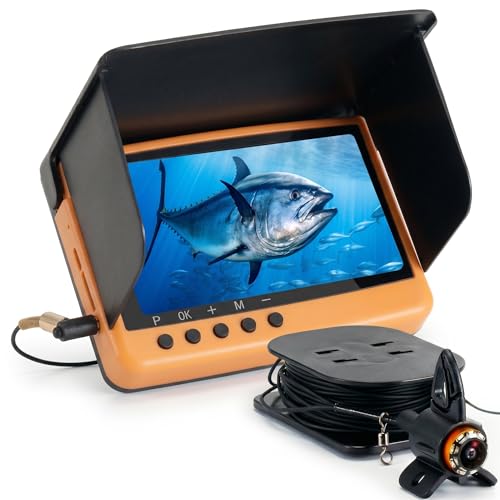
1.HD OLED Display & Wide View: Featuring a 5.5-inch anti-reflective OLED screen with 1080p resolution and 2000nit brightness, this fish finder ensures crystal-clear visuals even under direct sunlight. The 220° ultra-wide lens with adjustable angles (45°/90°/180°) provides flexible underwater perspectives, making this underwater fishing camera perfect for tracking fish movement with precision
Why Is My Fish Finder Showing Clutter or Noise
Clutter and noise on a fish finder screen typically result from sensitivity set too high, interference from other electronics, turbulence from your kayak’s movement, or environmental factors like algae, plankton, or suspended sediment in the water. The screen fills with random dots, streaks, or static-like patterns that obscure fish and structure.
Common causes and fixes:
- Sensitivity too high: Reduce sensitivity by 10-20% until clutter diminishes but fish arches remain visible
- Electrical interference: Turn off other electronics (VHF radio, GPS, phone) one at a time to identify the source, or route power cables away from the transducer cable
- Transducer placement: Ensure the transducer faces straight down and isn’t mounted near turbulent water flow from your paddle or hull design
- Algae blooms or plankton: Biological matter in the water column creates scattered returns; lower sensitivity and use zoom functions to focus on specific depth ranges
- Air bubbles: Paddling or wind-driven waves create bubbles under the transducer; slow down or wait for calmer conditions
- Frequency interference: If fishing near other boats with fish finders, switch to a different frequency or enable interference rejection in your unit’s settings
Most fish finders have a “noise filter” or “interference rejection” setting. Enable this feature if you see regular vertical lines or repeating patterns on the screen, these indicate electronic interference rather than environmental clutter.
Troubleshooting tip: If clutter appears suddenly in one location but clears when you move, it’s likely environmental (algae, baitfish, or suspended sediment). If clutter is constant regardless of location, check your sensitivity settings and electrical connections first.
How to Read Down Imaging vs Side Imaging on Fish Finder
Down imaging shows a narrow, photo-like view directly beneath your kayak, displaying bottom detail, structure, and fish in high resolution within a cone typically 20-30 degrees wide. Side imaging scans horizontally to the left and right, creating a wide aerial-view image of the bottom that can reveal structure up to 200 feet on either side, though with less detail on individual fish.
Down imaging characteristics:
- Appears as a vertical scrolling image in the center of your screen
- Shows fish as bright dots or small ovals (not arches)
- Reveals bottom texture, individual rocks, and small structure details
- Best for pinpointing fish location and identifying what’s directly below
- Works well for vertical jigging or precise positioning over structure
Side imaging characteristics:
- Displays as a horizontal split view (left side and right side of your kayak)
- Shows structure spreading outward like an aerial photograph
- Fish appear as small bright dots, often harder to distinguish than on down imaging
- Excellent for finding offshore structure, drop-offs, and isolated cover
- Helps you map large areas quickly without covering every foot of water
How to use both together: Run side imaging while searching for structure or productive areas, then switch to down imaging when you find something promising. Side imaging reveals where to go; down imaging shows exactly what’s there and helps you position your kayak for the best presentation.
Reading tip: On side imaging, structure closest to your kayak appears in the center of the screen, with distance increasing toward the edges. Shadows behind objects (appearing as dark streaks) indicate height, taller structure casts longer shadows, helping you identify stumps, boulders, or brush piles.
What Does a Thermocline Look Like on Fish Finder Screen
A thermocline appears as a distinct horizontal band or layer across your fish finder screen, usually showing as a color change or a hazy stripe suspended in the water column. This band marks the depth where water temperature drops rapidly, creating a density difference that reflects some of the sonar signal back to the transducer.
Thermoclines typically form in summer when warm surface water sits above cooler deep water, with the transition zone appearing between 10-30 feet deep in most lakes (depth varies by region and season). On your screen, the thermocline looks like:
- A fuzzy horizontal line or band stretching across the entire width of the display
- A subtle color gradient or hazy layer, often appearing greenish or yellowish on color units
- A zone where fish marks often concentrate just above or below the line
- A layer that remains at a consistent depth as you move across the water
Why thermoclines matter for fishing: The thermocline often holds dissolved oxygen and comfortable temperatures, making it a prime zone for suspended fish. In summer, game fish frequently hold just above the thermocline where oxygen is adequate and temperature is cooler than the surface. Below the thermocline, oxygen levels may drop too low to support fish, even though the water is cooler.
Seasonal variation: Thermoclines are strongest in mid-summer and may disappear entirely in spring and fall when water temperatures equalize (called “turnover”). In winter, some lakes develop a reverse thermocline with warmer water below colder surface layers.
Common mistake: Confusing a thermocline with a school of baitfish. Baitfish appear as a dense cloud of individual marks, while a thermocline is a smooth, continuous band with less defined texture. If you’re unsure, watch the feature as you move, baitfish schools will change shape and position, while a thermocline remains at a consistent depth.
Are Expensive Fish Finders Easier to Read Than Cheap Ones
Expensive fish finders are generally easier to read due to larger, higher-resolution color screens, better processing power that updates the display faster, and advanced features like CHIRP sonar and multiple imaging modes that provide clearer target separation. However, a budget unit with proper settings can still show fish and structure effectively for most kayak fishing situations.
Key differences that affect readability:
| Feature | Budget Units ($100-300) | Premium Units ($500-1500+) |
|---|---|---|
| Screen size | 3.5-5 inches | 7-12 inches |
| Resolution | 320×240 pixels | 800×480 or higher |
| Update speed | 5-10 Hz | 20-40 Hz |
| Sunlight visibility | Adequate | Excellent with anti-glare |
| Color depth | 16-256 colors | Thousands of colors |
| CHIRP sonar | Rarely | Standard |
| Side imaging | No | Often included |
When budget units work fine: If you fish primarily in shallow water (under 20 feet), target structure-oriented species, and don’t need to scan large areas quickly, a basic fish finder with a clear display and adjustable sensitivity will show you everything you need. Many kayak anglers successfully use budget units for years.
When premium units justify the cost: Deep water fishing (over 40 feet), offshore kayak fishing, tournament competition, or situations where you need to quickly scan and map large areas benefit significantly from premium features. The larger screen and faster updates make it easier to spot fish at speed and interpret complex structure.
Decision rule: Choose a budget unit if you’re new to fish finders or fish familiar waters where you already know structure locations. Upgrade to a premium unit if you frequently explore new water, fish deep offshore structure, or find yourself squinting at a small screen in bright sunlight.

Easy-to-use 7” color fishfinder with new vivid scanning sonar color palettes to easily distinguish fish and structure; tilt/swivel bailmount bracket included

FISHREVEAL: Fish are easier to find and easier to identify. FishReveal combines the target separation of Lowrance CHIRP sonar and the high-resolution images of structure from DownScan Imaging to makes fish light up on your display.

【Safe Travels】Fish finder cover strap holds fishing graph cover securely in place, Fish Finder Bungee Safeguard your valuable equipment from damage or loss while traveling
Common Mistakes Beginners Make Interpreting Fish Finder Data
Beginners often misinterpret clutter or noise as fish, rely too heavily on Fish ID icons instead of learning to read raw sonar, and fail to adjust sensitivity for changing conditions. These mistakes lead to frustration and missed opportunities, but they’re easy to correct once you understand what to look for.
Top interpretation mistakes and corrections:
Assuming every mark is a fish: Structure, vegetation, and even turbulence create marks on the screen. Look for the characteristic arch shape and suspension above the bottom to confirm fish.
Trusting Fish ID mode: Fish ID algorithms frequently misidentify structure, clutter, or strong bottom returns as fish. Turn off Fish ID and learn to read actual sonar returns for accurate information.
Ignoring sensitivity adjustments: Leaving sensitivity on auto or at one setting all day creates either cluttered screens (too high) or missed fish (too low). Adjust sensitivity every time depth or water clarity changes significantly.
Misreading depth scale: Not noticing that the depth scale has auto-adjusted can make you think fish are deeper or shallower than they actually are. Always check the depth numbers on the side of the screen.
Confusing side imaging orientation: Forgetting which side of the screen represents left versus right of the kayak leads to paddling in the wrong direction when you spot structure.
Expecting instant results: Fish finders need forward motion to build a picture. Sitting stationary shows only a vertical line; you need to drift or paddle to see arches and structure develop across the screen.
Overlooking zoom functions: Trying to see detail in 60 feet of water on a full-screen view makes fish marks tiny. Use the zoom function to focus on the depth range where fish are holding.
Practice tip: Spend time watching your fish finder in areas where you can see the bottom or structure visually (clear shallow water, around docks). This helps you correlate what the screen shows with actual underwater features, building your interpretation skills faster.
How to Identify Bottom Hardness on Sonar Screen
Bottom hardness appears on your fish finder screen as variations in the thickness, color intensity, and texture of the bottom return line. A hard bottom (rock, gravel, shell beds) creates a thick, bright band with warm colors (red, orange, yellow), while a soft bottom (mud, silt, sand) shows as a thin line with cool colors (blue, green) and minimal thickness.
Visual indicators of bottom composition:
- Thick bright band (3-6 pixels wide): Hard bottom, rock, gravel, shell beds, or concrete
- Thin line (1-2 pixels wide): Soft bottom, mud, silt, or fine sand
- Medium band with texture: Moderate hardness, packed sand, clay, or mixed composition
- Second return line below the bottom: Very hard bottom reflecting signal twice (called a “double echo”)
- Irregular or bumpy bottom line: Rocky or boulder-strewn bottom with varied composition
Why bottom hardness matters: Hard bottoms typically hold more baitfish, crayfish, and other forage because they provide better habitat than soft mud. Transitions from soft to hard bottom are prime fishing zones where predators ambush prey. Species like smallmouth bass, walleye, and many saltwater fish strongly prefer hard bottom areas.
Color palette consideration: The relationship between color and hardness is most obvious on color units with warm-to-cool palettes. Monochrome or grayscale units show hardness through return thickness and intensity (darker = harder) rather than color.
Verification method: If you’re unsure about bottom composition, drop a weight or jig to the bottom and feel it. Hard bottom feels solid and may click or tap, while soft bottom allows the weight to sink in with a mushy feel. After verifying a few spots, you’ll quickly learn to trust what your fish finder shows.
What Depth Range Should I Set My Fish Finder To
Set your fish finder’s depth range to show from the surface to 10-20 feet below the actual bottom depth, allowing you to see the full water column plus a buffer zone that keeps the bottom line visible even as depth changes. Most units offer auto-range (which adjusts continuously) or manual range settings for specific depth windows.
Range setting strategies:
Auto-range mode: Best for exploring unfamiliar water or when depth changes frequently. The unit automatically adjusts the display to keep the bottom on screen. The downside is that fish marks can appear to jump around as the scale changes, making it harder to track specific targets.
Manual range mode: Best when fishing a consistent depth or focusing on a specific zone. Set the range to show the depth window you’re targeting (for example, 0-30 feet if fishing in 20 feet of water). This keeps the scale constant, making fish marks easier to track and interpret.
Zoom mode: Most units let you zoom into a specific depth range while still showing the full water column in a smaller window. Use zoom to focus on the 10-foot zone where fish are holding, making their marks larger and easier to see.
Practical examples:
- Fishing in 15 feet of water: Set manual range to 0-25 feet
- Fishing in 40 feet of water: Set manual range to 0-50 feet, or use zoom to focus on 20-35 feet if that’s where fish are suspended
- Exploring new water with varying depth: Use auto-range until you find productive depth, then switch to manual range to focus on that zone
Common mistake: Setting the range too deep (showing 0-100 feet when fishing in 20 feet) compresses the display and makes fish marks tiny and hard to see. Match your range to the actual depth plus a small buffer for the clearest, most readable display.

Dual Beam Sonar: Choose from a narrow and a wide beam for great detail or a generous coverage area, helping you identify fish, structure and contours.

Delivers uninterrupted depth readings from 2.5 to 600 feet on the largest display available on an In-Dash Depth Sounder up to 60 mph. Transducer Frequency-200 kHz

【𝐄𝐚𝐬𝐲 𝐭𝐨 𝐔𝐬𝐞 】 Reelsonar portable fish finder is Easy to use, With a depth range of 135 feet and rechargeable battery life of 10+ hours, IOS and Android apps Bluetooth fishfinder with sonar
Can You See Baitfish vs Game Fish on a Fish Finder
Yes, baitfish and game fish create distinctly different marks on a fish finder screen. Baitfish appear as clouds or clusters of small, tightly packed marks that often look like fuzzy blobs or dense schools, while game fish show as larger, individual arches or marks that are clearly separated from each other and typically positioned near baitfish schools.
Baitfish characteristics on screen:
- Dense clouds of tiny marks clustered together
- Often appear as a solid mass with fuzzy edges
- May show as a thick horizontal band if the school is large
- Typically suspended in mid-water column or near surface
- Move and change shape as the school shifts
- Colors tend toward green or yellow (weaker individual returns)
Game fish characteristics on screen:
- Larger individual arches or marks with clear separation
- Distinct, well-defined shapes rather than fuzzy clusters
- Often positioned just below, above, or at the edge of baitfish schools
- Brighter colors (orange, red) indicating stronger returns
- May appear as single marks or small groups (2-5 fish)
- Frequently hold near structure or specific depth zones
Predator-prey relationship on screen: When you see a baitfish cloud with several larger individual marks nearby or mixed within it, you’ve found an active feeding zone. Game fish often suspend just below baitfish schools, rising to feed periodically. This pattern is one of the most productive scenarios to target.
Size estimation: While larger marks generally indicate larger fish, depth affects mark size significantly. A 2-pound bass at 10 feet may create a larger mark than a 5-pound bass at 40 feet due to the narrower sonar cone at depth. Use mark size to compare fish at similar depths rather than across different depth ranges.
Species-specific patterns: Some game fish school tightly (white bass, stripers, crappie) and may appear similar to baitfish clouds but with larger individual marks visible within the mass. Others (largemouth bass, pike, musky) are solitary and appear as isolated single marks.
Do I Need CHIRP Sonar to Read Fish Accurately
You don’t need CHIRP sonar to read fish accurately, but CHIRP technology provides better target separation, clearer arches, and improved detail, especially in deep water or when fish are tightly grouped. Traditional sonar works perfectly well for most kayak fishing situations in shallow to moderate depths (under 40 feet), and many successful anglers use non-CHIRP units effectively.
CHIRP sonar advantages:
- Better target separation: Distinguishes individual fish that are close together, showing multiple arches instead of one merged blob
- Clearer bottom detail: Reveals bottom composition and structure texture more precisely
- Improved depth performance: Maintains clarity and detail in deep water (over 50 feet) where traditional sonar loses resolution
- Reduced noise: Filters out clutter more effectively, providing a cleaner display
- Enhanced fish arches: Creates more defined, easier-to-read arch shapes
When traditional sonar is sufficient:
- Fishing in shallow water (under 30 feet) where target separation isn’t critical
- Targeting structure-oriented fishing where you’re looking for bottom features rather than suspended fish
- Budget constraints make CHIRP units impractical
- Fishing familiar waters where you already know productive areas
When CHIRP justifies the investment:
- Deep water fishing (over 40 feet) where you need maximum clarity
- Offshore kayak fishing where fish are often suspended and scattered
- Tournament fishing where every advantage matters
- Situations where you need to distinguish individual fish in schools (crappie fishing, for example)
Technical explanation: Traditional sonar sends a single-frequency pulse (for example, 200 kHz), while CHIRP sends a continuous sweep of frequencies (for example, 150-220 kHz). The range of frequencies provides more information per pulse, resulting in better resolution and detail. Think of it as the difference between taking one photo versus taking several photos and combining them into a higher-quality composite image.
Decision rule: If you’re new to fish finders, start with a quality traditional sonar unit and learn to read it well. If you find yourself frustrated by unclear marks in deep water or struggling to separate fish in schools, then consider upgrading to CHIRP. The technology helps, but learning to interpret sonar fundamentals matters more than the specific technology.
Frequently Asked Questions
How long does it take to learn to read a fish finder screen?
Most anglers can identify basic features (bottom, fish arches, structure) within 2-3 trips on the water. Becoming proficient at interpreting subtle details, adjusting settings for conditions, and distinguishing fish species takes 10-20 hours of screen time across different water types and depths.
Can I use a fish finder effectively while paddling a kayak?
Yes, fish finders work well while paddling at normal speeds (1-3 mph). Faster paddling creates more turbulence and can introduce air bubbles under the transducer, causing clutter. For best results, maintain a steady pace and mount the transducer in a location with smooth water flow.
Why do fish sometimes not show arches on my screen?
Fish only create arches when there’s relative motion between your kayak and the fish. Stationary fish appear as horizontal lines or dashes. Very fast-moving fish or fish that swim parallel to your kayak’s direction may also show as lines rather than arches.
What’s the best frequency setting for kayak fishing?
Higher frequencies (200 kHz) provide better detail and work well in shallow water (under 100 feet), while lower frequencies (50-83 kHz) penetrate deeper and cover a wider area. For most kayak fishing in shallow to moderate depths, 200 kHz or dual-frequency mode (showing both simultaneously) works best.
How do I know if my transducer is mounted correctly?
A correctly mounted transducer shows a clear, consistent bottom line without gaps or excessive noise. If you see intermittent bottom readings, vertical streaks, or loss of signal, the transducer may be angled incorrectly, mounted too high, or positioned in turbulent water flow.
Can fish see or hear my fish finder and avoid it?
Research shows that most fish don’t react to sonar signals from recreational fish finders. The frequencies used are outside the hearing range of most species, and the signal strength is too low to cause avoidance behavior. Your paddling and kayak presence are far more likely to spook fish than your fish finder.
Should I use 2D sonar or imaging modes for finding fish?
Use 2D traditional sonar for actively locating and marking fish, as it updates faster and shows fish arches more clearly. Use down imaging or side imaging for identifying structure and bottom composition, then switch back to 2D sonar when you’re ready to fish. Many anglers run split-screen mode showing both simultaneously.
What does it mean when the bottom disappears from my screen?
A disappearing bottom usually indicates you’ve moved into water deeper than your current depth range setting, your transducer has lost contact with the water (air bubbles, mounting issue), or you’re in extremely deep water beyond your unit’s capability. Check your depth range setting first, then verify the transducer connection.
How accurate are the depth readings on a fish finder?
Depth readings are typically accurate within 1-2% of actual depth when the transducer is properly mounted and the unit is calibrated correctly. In very shallow water (under 3 feet), readings may be less precise due to the minimum distance required for the sonar signal to travel and return.
Can I see my lure or bait on the fish finder screen?
In shallow water (under 20 feet) with high sensitivity settings, you can sometimes see larger lures (1 ounce or heavier) or weighted rigs as small marks descending through the water column. Most standard fishing lures are too small to create a reliable return, but you can often see them when they reach the bottom.
Why does my fish finder show different depths than my friend’s unit?
Different units may measure depth from different reference points (transducer location versus water surface), use different sound velocity settings, or have calibration variations. Differences of 1-2 feet are normal and don’t affect fishing effectiveness. Both units are showing relative depth changes accurately, which is what matters for finding fish and structure.
Do I need GPS on my fish finder for kayak fishing?
GPS isn’t essential for basic fish finding, but it’s valuable for marking productive spots, tracking your path, and navigating back to launch points. For kayak fishing in large lakes, coastal areas, or unfamiliar water, GPS significantly improves efficiency and safety. In small ponds or familiar rivers, you can fish effectively without it.
Conclusion
Learning how to read a fish finder screen transforms your kayak fishing from guesswork into informed decision-making. By understanding what colors represent, recognizing the difference between fish arches and structure, adjusting sensitivity for your conditions, and interpreting the various imaging modes, you’ll spend more time fishing productive water and less time searching blindly.
Start with the basics: identify the bottom line, learn to spot fish arches, and practice adjusting sensitivity in different depths and water clarities. As you gain experience, you’ll naturally begin to recognize patterns, how baitfish schools look, where game fish position themselves relative to structure, and what bottom composition holds the most fish in your local waters.
Your next steps:
- Take your fish finder out on familiar water where you already know fish locations, and practice correlating what you see on screen with what you catch
- Experiment with sensitivity settings in different conditions, noting what works best for shallow versus deep water
- Turn off Fish ID mode and commit to reading raw sonar returns for more accurate information
- Practice distinguishing between fish, structure, and clutter by circling back over marks to see if they remain consistent
- Use zoom and range functions to focus on productive depth zones rather than always viewing the full water column
The fish finder is a tool that reveals what’s happening beneath your kayak, but it doesn’t catch fish for you. Combine what you learn from the screen with your knowledge of fish behavior, seasonal patterns, and local conditions. Over time, reading your fish finder will become second nature, giving you the confidence to explore new water and consistently find fish wherever you paddle.